
Disclaimer: This page is a guide only. It is for use by competent medical professionals with paediatric training. It cannot replace specialist experience and it is your responsibility to decide when to ask for help. The site and its creators do not accept any liability from interpretation using this guide.
Evaluate the history
Collapse or abnormal breathlessness on or shortly after exercise should increase your vigilence for cardiac pathology.
This is a very common presentation to paediatric medicine. Cardiac syncope is rare but when syncope occurs on exertion or just after exertion this is suspicious for a primary cardiac cause and warrants careful investigation and discussion even in the presence of a normal ECG.
Certain forms of Long QT for example are most prone to arrhythmia at peak exertion or within five minutes after. This is because the QT interval paradoxically lengthens during recovery. Hypertrophic cardiomyopathy equally is vulnerable to low cardiac output and arrhytmia at higher heart rates on exercise or even mild exertion such as climbing the stairs. Ensure you establish a family history of unusual events including sudden death.
Conversley syncope or pre-syncope (dizziness) is common in relation to postural change or when rising from sleep, especially in teenagers. This is rarely cardiac.
An atypical presentation but one which can be specific for cardiac disease. For us this is in the silver medal position for cardiac specificity.
Consider whether the breathlessness is out of proportion to the exertion. A child who cannot walk up a flight of stairs without stopping is not normal. Cardiac breathlessness is often at lower levels of exercise than you might expect.
This is a common paediatric presentation and does not carry a high specificity in paediatrics. Palpitations are simply awareness of the heart beat. Your role is to establish if these sound like abnormal awareness of normal rhythm (common in anxiety) or normal awareness of an abnormal rhythm. Forceful thudding is often benign whereas rapid fast heart beats with sudden onset 'like a light switch' are more typical of a tachyarrhythmias. Ventricular arrhythmias are thankfully rare outside of those with previous surgery, supraventricular arrhythmias are usually well tolerated and you have time to assess. This is very different if the patient has cardiac instability (collapse or dizziness) with the palpitations. Take a careful history and think about panic attacks as a differential (hyperventilation reduces CO2 and causes dizziness with numbness in extremities).
A very rare symptom of cardiac disease in children, this is more commonly growing pains such as pre-cordial catch or costochondritis. Reassuring features might include sharp, sudden onset and short lived pain with no other associated symptoms. You views on this might change in the context of pleuritic like pain and infection with attention being needed to features of pericarditis.
The pink happy chatty toddler with a soft murmur is in contrast to the teenager with a loud murmur. Remember that flow murmurs are increasingly rare in older children. Be cautious in the youngest children or those approaching secondary school age. This however is an easy one for diagnosis, they just need a scan. Triangulating your other symptoms including subtle tachypnoea or faltering growth together with your ECG can help you work out the priority for that echo (same day, urgent or routine).
Evaluate the Rhythm Strip
Review every complex for a P wave, QRS and normal PR interval. Then check the rate.
On a standard 12 lead ECG, the rhythm strip gives you a ten-second insight. Check each p-qrs complex to confirm sinus rhythm. Sinus rhythm requires an upright P wave of the same shape before every QRS with a normal PR interval.
Check P Wave Regularity: Look along the rhythm strip to see if there is an identical P wave before each QRS? Is the P wave upright in Leads I, II and aVF?
Check P Wave Size: P waves should be small and narrow. That means less than 3 small squares high and less than 2 small squares wide.
Check PR Interval: This represents the time taken for the atria to depolarise so in smaller children with smaller hearts this is naturally shorter. It shortens further at faster rates. It is calculated from the start of the P wave to the start of the QRS. Too short is pre-excitation, too long is heart block. Normally it is about 3 small squares. If it is not check these guideline values
| AGE | Average PR | Lower limit | Upper limit |
|---|---|---|---|
| 1-4 weeks | 100 | 80 | 120 |
| 1-6 months | 100 | 90 | 140 |
| 7-12 months | 110 | 100 | 140 |
| 1-3 years | 110 | 100 | 150 |
| 3-8 years | 130 | 120 | 170 |
| 8-12 years | 150 | 120 | 180 |
| 12-16 years | 150 | 120 | 190 |
| Adult | 160 | 120 | 210 |
All values in milliseconds (40ms = 1 small square)
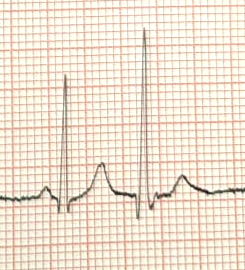
P waves upside down Low atrial rhythm is a normal variant in children. If the sinoatrial node is situated below the normal position then every P wave in Lead II, II and aVF are inverted. Inversion just in Lead III is entirely normal. If only some P waves are upside down then this is an ectopic focus and the patient may be more prone to ectopic tachycardia, refer these.

Narrow QRS without a P wave These are likely supraventricular ectopics. They originate from within the atria but the P wave is typically of a different morphology or not visible hidden in the preceding T wave, sometimes giving a camel-humped appearance. Supraventricular ectopics simply look like QRS complexes without the P wave. All the QRS complexes should however look similar. SVEs are a common variant. You shouldn't have too many (less than 10-20%) and they shouldn't occur in sequence. Don't forget to link with your history.
Wide QRS without a P wave These are likely ventricular ectopics. They arise often from spontaneous depolarisation of the ventricles. This means the ventricles are depolarised directly and not via the fast bundles. This produces a broad QRS complex which looks odd. The abnormal depolarisation also produces discordant repolarisation (ST depression and T wave inversion in leads with a dominant R wave, ST elevation with upright T waves in leads with a dominant S wave) as well as a full compensatory pause (the next R-R interval is double the preceding). As in supraventricular ectopics, unifocal ectopics are easily identified as they are identical, whilst multifocal ectopics have multiple morphologies. Multi-focal VEs warrant a closer look, unifocal VEs are normal in lower percentages around 5-10%.

Slurred QRS without a P wave These are likely junctional ectopics, the half way house of the above. They are far less common than supraventricular or ventricular ectopics. The impulses here arise from the atrioventricular node and are often suppressed by faster impulses originating in the atria. The typical appearance of a junctional ectopic is of a QRS complex with slurring of the upstroke, no obvious p wave and a compensatory pause. These are another normal variant, especially in patients with very low heart rates e.g. eating disorders. A normal echo would help provide reassurance in these cases.
The PR Interval is too short This can be a normal variant but suggests pre-excitation which is a precipitant of SVT. WPW is the extreme version here where the P wave is slow close to a slurred QRS (delta) that they actually touch. A short PR in association with palpitations warrants a review. All WPW (Even if asymptomatic) should be referred.

The PR Interval is too long This is first degree heart block. It is really common at lower heart rates, in healthy children or with high vagal tone. The PR interval is the same for every beat.
The PR Interval is getting longer This is second degree heart block (Mobitz 1, Wenckebach). Again really common at lower heart rates, in healthy children or with high vagal tone. This is frequently seen at night in resting children, in that situation it is rarely sinister.
The PR Interval is normal but some beats are skipped This is second degree heart block (Mobitz 2). It is much less common in children although can again occur with high vagal tone. Worth chatting to a friendly cardiologist about this one.
The P-QRS is totally irregular Third degree or complete heart block represents no conduction through the AV node, and is seen as a complete dissociation between P waves and QRS complexes. If you are not sure then simply using the term AV dissociation makes you look clever and is also true. AV dissociation is never normal and always warrants investigation.

Tall P wave P pulmonane, suggestive of right atrial dilatation.
Prolonged or bifid P wave P waves that are prolonged (wide) or bifid - P mitrale - are suggestive of left atrial dilatation.
Prolonged PR interval is suggestive of first degree heart block. Often this represents a normal variant. However, 1st degree AV block is also seen in myocarditis, drug toxicity, congenital heart disease, hyperkalaemia and ischaemia. A progressive lengthening of the PR interval, before a QRS complex is missed represents Mobitz type 1. It is most commonly seen in sleep and found in ECGs of asymptomatic individuals. While all these patients need further investigation following discussion with a paediatric cardiologist, most will be found to remain in a safe rhythm and require no active treatment.
Calculating and interpreting the rate is a straightforward process and uses information from the rhythm strip. Whilst the rate will likely be automatically calculated on the ECG in front of you, it is always worth double checking, especially in the context of any irregularity.
Check Paper Speed: The standard paper speed for a twelve lead ECG is 25mm/second. In practice, this means that when looking at an ECG one small square represents 40 milliseconds. If it is not standard speed then all the normal calculations below don't apply.
Check Rate: Assuming standard paper speed, count the number of QRS complexes on one ECG and multiply by 6. There are other ways but this is quick and allows for rhythm irregularity.
Compare Rate: Use the table below to check if your rate is normal.
If there is variable or no relationship between P waves and QRS complexes (such as in heart block) then the atrial (count the P waves and multiply by 6) and ventricular (count the QRS complexes and multiply by 6) rates should be calculated separately.
| AGE | Heart Rate |
|---|---|
| 1-4 weeks | 100 - 180 |
| 1-6 months | 100 - 180 |
| 7-12 months | 100 - 170 |
| 1-3 years | 90 - 150 |
| 4-5 years | 70 - 140 |
| 5-7 years | 65 - 130 |
| 8-11 years | 60 - 110 |
| 12-16 years | 60 - 100 |
1. The rate is fast: Is this a narrow complex tachycardia or a broad complex tachycardia? Narrow complex tachycardias - can you see P waves? If not then you may have SVT. Vagal maneouvres or Adenosine are your friend here in diagnosis. If you can see P waves then you need to ask if this is an appropriate tachycardia (fever, infection, pain, stress) or inappropriate and out of keeping with the presentation - needs more investigation. Broad complex tachycardias are rare in children outside of cardiac surgery. More commonly this will be the first presentation of SVT with underlying WPW. We call this SVT with abberancy. If the child is well (they should be with SVT) then you have time to phone a friend and consider an adenosine trial (with your big pants on and defib to hand).
2. The rate is slow:Clinical context is crucial. Asleep and well or head injury and hypertensive. Very low rates with poor perfusion are highly abnormal. A relative bradycardia is also seen in Long QT Syndrome so be cautious about the yunger child with a lower rate.
Evaluate the Axis, QRS Height and Width
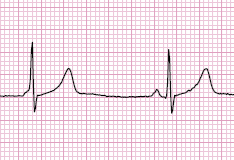
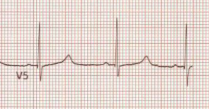
QRS in lead II almost all upright, width less than 3 squares, small R wave in V1, almost no S wave in V6.
Interpreting the axis is a intimidating. Let's make it easy. Remember the ‘normal’ axis varies with age. The QRS axis is found by comparing the R and S wave in a limb lead. Mostly in paediatrics you should find that in Lead II there is a dominant R wave and only a small or no S wave. Newborns are a bit of an exception.
Look for a limb lead (not a V1-6) where there is almost a pure R wave and no S wave. The axis is exactly in the direction of that lead. Compare it to the picture below.
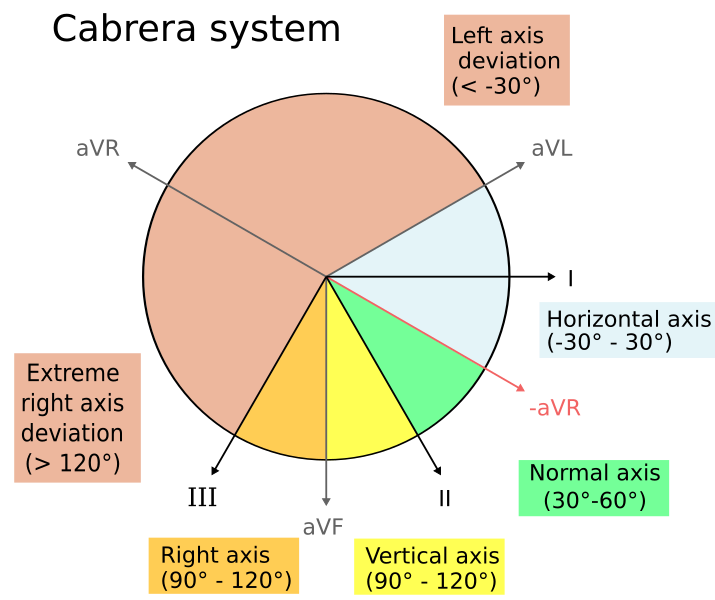
You can check this with more rules: If there is only an S wave, then it is directly opposite. If the R wave and S wave are equal then it is at 90° to that lead. For nearly all children the normal cardiac axis is down and to the left (in the direction of lead II). Now adapt that principle for the age of your child: Newborn infants - axis is more rightward (almost no S wave in lead III). Young adults - axis is more leftward (mostly positive in lead I and II)
Check the following don't apply:
Superior Axis - Lead I, II and aVF are nearly all negative.
Right Axis - Lead I is negative, lead II is balanced, III is nearly all upward. This is normal in newborns.
Left Axis - Lead I is positive but lead III is heavily negative.
Here is the full list for normal axis values:
| Age | Normal Axis | Range |
|---|---|---|
| 0 - 4 weeks | +110° | +30° to +180° |
| 1 month – 3 months | +70° | +10° to +125° |
| 3 months – 3 years | +60° | +10° to +110° |
| Over 3 years | +60° | +20° to +120° |
| Adult | +50° | -30° to 105° |
Right axis deviation describes an axis between 90° and 180° and, when using the quadrant method, is shown by an upward QRS in lead I and a downward QRS in aVF. In neonates up until the age of 1-month, right axis deviation is completely normal. This is because, in-utero, the blood is shunted away from the pulmonary vasculature leading to higher pulmonary pressures and a relatively larger right ventricle. As the circulation normalises after birth, as does the axis and it should be expected to have reverted to a normal axis by 6 months of age. Some degree of right axis deviation can be seen in older children or even thin adults but, depending on presentation, it probably warrants further investigation. If it persists beyond the expected age range then it is most commonly seen in right ventricular hypertrophy, but can also be seen in conditions including hyperkalaemia, Wolff-Parkinson-White syndrome, ventricular ectopy and acute lung disease causing right heart strain, such as a pulmonary embolus.
Left axis deviation describes an axis between -90° and -30° and, when using the quadrant method, is shown by a downward QRS complex in lead 1 and an upward QRS in aVF. Using the above diagram, it is easy to see that, when using the quadrant method, it is possible to interpret a normal axis as left axis deviation as normal goes up to -30°, which sits in that right upper quadrant. This is an example of when you might want to use another method to interpret the axis, such as by three lead analysis. Confirmed left axis deviation needs investigating and can be seen in conditions including left ventricular hypertrophy, left bundle branch block and Wolff-Parkinson-White syndrome too.
Superior or Extreme axis deviation or a north-west axis describes an axis in between -90° and 180° and, when using the quadrant method, is shown by downward QRS complexes in both lead I and aVF. This is especially relevant in paediatrics. In neonates, a north-west axis is seen with AVSD, an ostium primum atrial septal defect and occaionally VSDs, all of which will need discussion with a center for cardiac surgery for consideration of repair. It can also be seen in ventricular rhythms but is most commonly seen secondary to misplacement of the limb leads (right arm and left leg leads switched).
QRS amplitude represents the voltage generated on depolarisation of the ventricles. Large voltages occur with more muscle mass and varies with age. Body habitus is also important and in larger children hypertrophy may only be apparent not by complex size but by the relative size of R and S waves. Equally slim children often have large complexes, especially in V3 and V4 which is why we don't use these leads for normal value checks. We recommend you check this every time. It is too easy to miss subtle LVH.
Don't forget all of this assumes you are using normal voltages and not half lead voltage. Normal voltage is 10mm/mv.
Now measure the size of your R and S wave in V1 and V6 and check against the table for that age.
| Complex | R wave V1 | S wave V1 | R wave V6 | S wave V6 |
|---|---|---|---|---|
| 0-1 months | 13-24 | 7-18 | 5-15 | 3-10 |
| 1-6 months | 10-19 | 5-15 | 13-22 | 3-9 |
| 6-12 months | 10-20 | 7-18 | 13-23 | 2-7 |
| 1-3 years | 9-18 | 8-21 | 13-23 | 2-7 |
| 3-8 years | 8-16 | 11-23 | 15-26 | 2-5 |
| 8-12 years | 5-12 | 12-25 | 17-26 | 1-4 |
| 12-16 years | 4-10 | 11-22 | 14-22 | 1-4 |
| Young adults | 3-14 | 10-23 | 10-21 | 1-13 |
High QRS amplitudes increase in the voltage so a higher number or size of myocytes. Ventricular hypertrophy, or ventricular conduction disturbances such as bundle branch blocks are the common causes and would warrant further investigation.
Low QRS amplitudes low voltage so either more interference or reduced myocyte function. Pericarditis, myocarditis and hypothyroidism are the commonest pathological causes.
This is a relatively easy assessment. The width represents the speed of conduction in the ventricles from the first to the last myocyte. It should always be less than 120 milliseconds (3 small squares). It actually reduces with age. If you want the average and upper limit of normal these are below. When you find a prolonged QRS then there is abnormal transmission through the conduction bundle delaying depolarisation.
Be aware that in children the shape of the QRS is often not just a simple R then a simple S wave. Changes can occur to give two R waves (RSr) or even two S waves (sRs). We've even seen four RSrs. If you have ever wondered about the letter size then we use little letters to denote a small complex and capitals to indicate a large complex. See the abnormalities section for the variations of these.
| QRS Duration (ms) | Average | Upper Limit |
|---|---|---|
| 0–12 months | 50 | 70 |
| 1–3 years | 60 | 70 |
| 3–8 years | 70 | 80 |
| 8–12 years | 70 | 90 |
| 12–16 years | 70 | 100 |
| Adult | 80 | 100 |
Partial Right Bundle Branch Block:An RSr or RsR pattern in V1 but with a normal maximum 3 square total width. This is a normal variant in children occuring due to relative right dominance and change in conduction through the septum and bundle.
Right Bundle Branch Block (MARROW):This gives the same pattern as above but with a prolonged QRS width. MARROW is a M wave in V1 and a W in V6 for 'RR' Right block. It isn't always this easy so look in leads V1 and V2, the first deflection is positive (r or R) and maybe smaller than the blurred second upward stroke. In V6 there will probably (but not always) be a small initial negative defections, then a large R wave and a second wide S wave. This is very common after cardiac surgery to the ventricular septum or right outflow tract e.g. Tetralogy of Fallot. You must review the history and previous ECGs to see if this fits.
Left Bundle Branch Block (WILLIAM):WILLIAM is a W wave in V1 and a M in V6 for 'LL' Left block. It isn't always this easy so look in leads V1 and V2, the first deflection is negative (s or S) the middle of the W (the r) is often quite small and subtle before another S. In V6 there will probably be a wide R wave, possibly with a notch for the little s (middle of the W) at the top. This is really uncommon and not normal. Cardiomyopathy, cardiac strain and even ischaemia are on your differential. The last is rare but you should think about Digoxin toxicity or hyperkalaemia - the most common causes for this pattern in paediatrics.
Evaluate the ST Segment, T wave direction and QT interval
Is the ST isoelectric, no Brugada, lateral T waves upright and calculate the QTc under 450ms.
The ST segment begins at the end of the S wave and ends at the beginning of the T wave. The J point is the junction of the QRS and the ST segment. Together they represent the interval between ventricular depolarisation and repolarisation. So what should you look for here:
The ST segment should be isoelectric or minimally raised (1mm in limb leads (I,II,II, aVR, aVL, aVF) and up to 2mm in precordial leads (V1-V6)).
Always check for ST elevation in limb leads but importantly check for Brugada in V1 (you can read about that in the abnormalities). You should also be aware of Benign Early Repolarisation (BER) which is very common. Finally there's a rare entity called Epsilon waves but this can be a bad sign for an unusual but lethal cardiomyopathy
Benign early repolarisation (BER), where the ST segment is elevated as it enters the T wave, best seen in V4-6. The T waves will be asymetrical. It can look like ST elevation but the history wont fit. This is a common varient in healthy older children.
Coved or saddle-back ST elevation in V1 or V2? In coved ST elevation the ST segment is lifted up to the top of the QRS and the ST segment literally is like a slide into an inverted T wave. Brugada is a channelopathy and needs referral as it carries a risk of sudden death.

J-point depression is a phenomenon where the J point (where the QRS complex joins the ST segment) is depressed without ST depression. This is normal in children.
Widespread ST elevation can occur in pericarditis or myocarditis with ischaemia of the muscle (in essence a sort of STEMI)
The T wave represents repolarisation of the ventricles. T waves are initially upright before inverting in leads V1-V3 soon after birth (usually in the first week of life). This inversion usually persists until the age of 8 years, before they are all again upright. The usual patttern of this is for V3 to turn upright first, followed by V2 and finally V1. This can persist into adolecence and is described as persistent juvenile T waves, and persistent inversion of the T wave in V1 can persist and remain even in adults.
T waves should never be inverted in lead V5 or 6. They shouldn't be too tall or more imporantly too flat.
Tall, peaked T waves can suggest left ventricular hypertrophy, but should also raise concerns about the possibility of hyperkalaemia.The T waves in leads 5 and 6 should always be upright, and inversion suggests left ventricular hypertrophy. Inverted T waves in V5 and V6 should also raise concerns for left ventricular hypertrophy - they should be upright in a normal ECG. T waves may also be tall in benign early repolarisation as previously described.
Flattened T waves can be an entirely normal finding in new borns but should be considered pathological in other children. They are a particular hallmark of Long QT syndrome - look for long shallow sloping T waves. This can also occur in hypothyroidism, hypokalaemia, hypoglycaemia or hyperglycaemia, myocarditis, pericarditis, ischaemia.
Inverted T waves in V5 and 6 are never normal. Whilst the other chest leads sequentially flip from inverted to upright these two leads should always be positive. An inverted T wave here suggests significant cardiac strain and warrants a careful review.

What are U waves? If you look carefully (especially in V2 and V3) on a good quality ECG of a healthy child at a lower heart rate you will often see a small positive deflection (like a mini T wave) just after the T wave. We think they occur because of repolarisation of the main bundle. They are typically seen in a healthy heart with a low rate, rarely hypokalaemia or hypothermia make them more evident. These alone are a non-signficant feature.
Finally, calculating the QT interval! The QT interval representes the time taken for the ventricles to contact and subsequantly relax. It should be measured from the start of the first deflection of the Q wave to where the ECG becomes isoelectric following the T wave. If there is a U wave which is clearly separate to the T wave it should not be included in the calculation of the QT interval. The QT interval is inversley propotional to heart rate and therfore must be corrected for heart rate (QTc), most commonly by using the Bazzet formula: QTc=QT/√RR
It’s important to recognise this relationship between heart rate QT interval. Calculating the QT interval in a tachycardic patient is more difficult and less reliably completed as small changes in the length of the QT are both more difficut to measure and result in a bigger change in the equation above.
The QTc in very young infants is frequently longer than in adults and values up to 470ms (or even 490ms) are acceptable. In children older than this it should be less than 450ms. In females particularly around puberty 460ms is acceptable as average QT intervals are longer.
A QT interval more than 480ms warrants same day discussion with cardiology
Prolonged QTc may represent a long QT syndrome, or be a finding in hypocalcaemia, myocarditis, raised intracranial pressure or a number of medications. In Long QT look for other evidence such as small low volume T waves, notches in the T waves or a relative bradycardia. Worry more about these patients if they present with exercise induced syncope.
A short QTc No agreed diagnostic cut off but typically less than 320ms. This can be seen in hypercalcaemia or congenital short QT syndrome (which is extraordinarily rare).
EasyBeat came about after we recognised a absence of a free to use, one-page resoure for clinicians to aid in interpretting paediatric ECGs. By being able to better interpret paediatric ECGs, clinicians can not only be more confident in their diagnoses and reporting this to patients and their families but also make more efficient referrals to paediatric cardiology services when needed. Dr Fenner is a consultant paediatrician with a speialist interest in cardiology and Dr Southgate is a paediatric trainee who both have an interest in using technology to support clinicians in the care of their patients. We hope you find the information helpful and we are always open to criticism, thanks, help or even the occasional coffee.
We want to make EasyBeat as useful for clinicians as possible, and that means we want to know how you’ve found using it! Whether it’s been helpful to your practice, you’ve spotted an error or theres something extra you think would be helpful, send us your comments, offers of help and coffee vouchers :) to hello@easybeat.info
EasyBeat has been designed as an aid to interpretting paediatric ECGs only and should only be used by competent medical professionals with paediatric training. It should be used as a guide only and cannot replace specialist experience and it is your responsibility to decide when to ask for help. The information within this website and any linked materials are not intended to be nor should be used as medical advice. It does not replace local or national guidelines in advising patient management nor is it any substitute for expertise. Comments sent to the site email should be related to site only and should not be used to request clinical advice. Any such emails will not be responded to. The site and its creators do not accept any responsibility or liability from interpretation using this guide . The views expressed in this website have no rela¬tion to those of any academic, hospital, practice or other insti¬tu¬tion with which the authors are affiliated.